14 runs, 0 alerts
A systemd watchdog ran 15 mornings, failed to connect on 14 of them, and sent zero alerts — because it shared a dependency with the thing it watched.
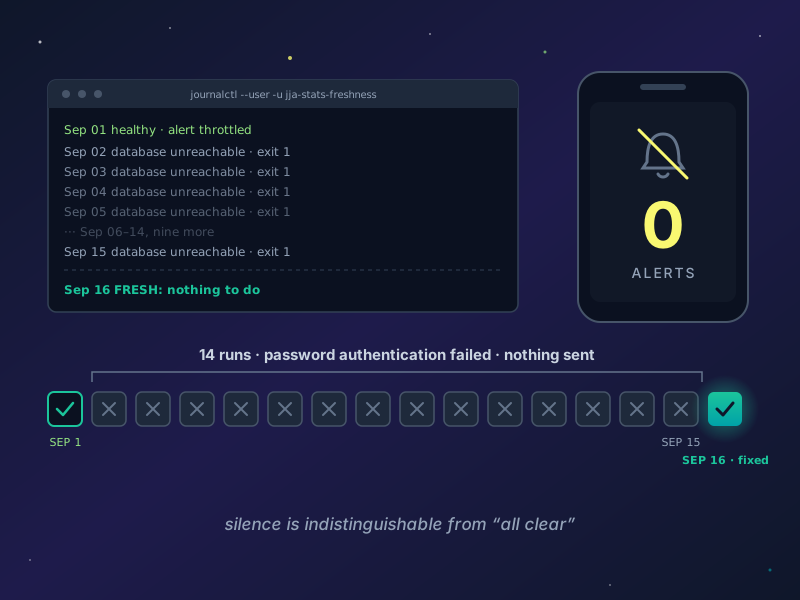
Fifteen mornings in a row, a systemd timer checked whether my dashboard’s data had gone stale. Fourteen of those runs couldn’t reach the database, and not one of them sent an alert — a silent failure inside the one script whose whole job was noticing when something had quietly stopped.
The watchdog wasn’t broken in the usual sense. It did exactly what I wrote. It shared a dependency with the thing it watched, and when that dependency broke, it went quiet, and quiet looks exactly like “all clear”.
The watchdog worked, and August 31 proves it
The receipts on this site publish statistics about how I use Claude Code, pulled from my local memory database, a PostgreSQL instance on my own machine. Cloudflare’s edge can’t reach localhost, so the dashboard is a build-time snapshot: pnpm stats:snapshot reads credentials from a gitignored .db.env, writes src/data/stats.json, and the next deploy carries it. The workflow that feeds it is in the launch post.
A snapshot goes stale if nobody refreshes it, so the page watches its own age. A small Vue island recomputes the age in the visitor’s browser every time the page loads; past seven days, it appends ”— due a refresh”.
That covers visitors. For me there’s scripts/check-freshness.mjs, run every morning by a systemd user timer that fires between roughly 09:30 and 09:45 Mountain. I wrote it on August 24. It reads three sources: the local database, dev.jjaimealeman.com/freshness.json and jjaimealeman.com/freshness.json. If the snapshot is more than seven days old, it pushes a notification to my phone through ntfy, and the message names the command that fixes the problem.
It re-notifies at most once every three days. The comment in the code explains why: “the same message every morning gets muted, and a muted watchdog is worse than none.”
And it worked. On August 31 at 09:36 it found a stale snapshot and pushed a real alert. On September 1 at 09:33 the snapshot was still stale and the alert was throttled (“notified 1.0d ago”), which is correct. Around 12:12 that day I refreshed the snapshot.
Then I rotated a password.
One password, two files: how the watchdog failed silently
Later on September 1, I rotated a database password. ~/.claude/.env got the new one. This repo’s .db.env kept the old one.
That single file had two readers. pnpm stats:snapshot stopped connecting, so the snapshot froze at September 1. The watchdog read the same credential from the same file, so it stopped connecting too.
Fourteen failures, all logged where nothing reads
Here is what fail() looked like before the fix:
const fail = (msg) => {
  console.error(`check-freshness: ${msg}`);
  process.exit(1);
};
Under systemd, stderr goes to the journal, and nothing I look at reads the journal. The only channel that reached my phone was ntfy, and ntfy was only called on the path where the database connection had succeeded and the snapshot’s age could be measured. When the connection failed, the script wrote a line to the journal and exited without sending anything.
I pulled the numbers from journalctl on September 16:
| Measure | Count |
|---|---|
| Runs from September 1 until the fix | 15 |
| Runs that failed to reach the database | 14 |
| Alerts sent | 0 |
The first of those fifteen runs, on September 1, succeeded. The other fourteen, September 2 through September 15, each wrote the same line (role name trimmed):
check-freshness: database unreachable: password authentication failedExit 1, no push, every morning.
The snapshot crossed the seven-day line around midday on September 8, just after that morning’s run. So September 9 was the first run that should have alerted. With the three-day throttle, alerts were due on September 9, 12 and 15. None of them went out.
The failure was recorded. systemd logged each of the fourteen as Failed to start with status=1/FAILURE. The information existed; it just sat in the one place I never look.
From September 8 on, the site did its job: anyone who opened the dashboard was told the numbers were old. Visitors got the warning and I didn’t.
I only found out because I happened to look. Around 01:00 on September 16 I was shipping a new /about page with four stat tiles that read from the snapshot. The tiles showed data 15 days old. I ran the refresh and it failed on the credential.
I tested the password in ~/.claude/.env against both the connection pooler and Postgres directly, both accepted it, and then I copied it into .db.env. I didn’t guess at anything or alter any role. The snapshot refreshed at 01:24: sessions went from 4,638 to 4,825 and messages from 306,717 to 324,084 — 187 sessions and 17,367 messages, 15 days of work the dashboard had not been showing.
The fix: a monitoring script that alerts on its own failure
The principle, from the changelog I wrote that night:
A monitor that shares its subject’s failure mode reports silence, and silence is indistinguishable from “all clear”.
The watchdog could report that the snapshot was stale. It had no way to report that it couldn’t tell. “I cannot check” is worse news than “the number is old”, and the script was only built to deliver the second one.
Commit 5008bbc changes that. First, a push() helper that POSTs to ntfy and never throws, because a broken notifier must not mask what it was trying to report. Then fail() became async and pushes before it exits:
async function fail(msg) {
  console.error(`check-freshness: ${msg}`);
  if (!DRY_RUN) {
    let last = null;
    try {
      last = JSON.parse(readFileSync(FAULT_STATE_FILE, "utf8")).lastNotified;
    } catch {
      /* no stamp, or unreadable — treat as never notified and alert */
    }
    const daysSince = last ? (Date.now() - Date.parse(last)) / DAY_MS : Infinity;
    if (FORCE || daysSince >= FAULT_RENOTIFY_DAYS) {
      const sent = await push(
        "jjaimealeman.com freshness watchdog is blind",
        `The watchdog cannot check anything:\n\n${msg}\n\n` +
          `Until this is fixed, no staleness alert can be raised — silence from ` +
          `it means nothing. Snapshot age is unknown, not fine.`,
        "high",
        "warning",
      );
      if (sent) { /* write the fault stamp */ }
    }
  }
  process.exit(1);
}
Four choices in there aren’t obvious:
- The fault alert has its own throttle. It has its own state file,
freshness-fault.json, and its own interval,FAULT_RENOTIFY_DAYS = 7. With one shared stamp, a staleness alert could suppress a fault alert or the reverse, and the fault is the more urgent of the two. - Seven days, not three. A fault lasts until someone fixes it. A daily push about the same fault teaches you to swipe it away.
- A healthy run clears the fault stamp. Otherwise a leftover throttle from the last outage could delay the alert for the next one.
- An unreadable stamp counts as “never notified”. If the state file is corrupt, the script sends the alert.
The bug inside the fix was two spaces wide
Making fail() async meant every call site needed await. Without it, process.exit(1) runs before fetch resolves and the push never leaves the machine.
There were four call sites. A scripted replacement updated three of them. The one it missed was the database-unreachable call, the exact path the whole change exists for, because its indentation differed by two spaces.
-  fail(`database unreachable: ${err.message}`);
+  await fail(`database unreachable: ${err.message}`);
I caught it by grepping every call site after the replacement instead of trusting the count it reported. If I had trusted that count, the fixed watchdog would have stayed silent in exactly the situation it was fixed for. I wrote this in the changelog that night: “a fix that appears complete and does nothing is the same shape as the bug it was fixing.”
What this still can’t see
I tested it on September 16, end to end, against the real database and a real ntfy topic. What I ran:
- A healthy run sent no fault alert.
- A simulated outage, the September failure reproduced with a deliberately wrong password: a real push arrived and the stamp was written.
- An immediate second outage was throttled: “0.0d ago, re-notify after 7d”.
- A healthy run cleared the stamp.
- A fresh outage after that alerted immediately.
--dry-runsent nothing.
Two paths are untested: the “NTFY_TOPIC not set” case and the “ntfy returned an HTTP error” case. I checked the seven-day boundary by reading the arithmetic the script prints, not by waiting a week.
And there are gaps this fix doesn’t touch:
- The fault alert only fires if the script runs. If the timer never fires, the machine is off, or systemd itself is broken, I still get silence. The standard answer is a dead man’s switch: an external service such as Healthchecks.io that alerts when an expected ping stops arriving. I haven’t built one.
- If ntfy is down,
push()returns false and the failure goes to the journal, the same place that failed me in September.
systemd also has its own OnFailure= setting, which can start another unit whenever this one fails. This setup doesn’t use it, and it wouldn’t cover the first gap anyway: it needs a running systemd on a running machine too.
So this fix closes one kind of silence, not all of them.
Third time, same shape
The changelog calls this the third instance of the same failure class on this project.
The first was a curl staleness check. SnapshotAge is a Vue island, so its text gets baked into the HTML at build time and recomputed in the browser on hydration, and curl never runs JavaScript. On September 1, grepping production HTML for “due a refresh” found zero hits and “snapshot taken yesterday”, frozen from the build. Every real visitor had been seeing “last week — due a refresh” for a day. That check fails in the reassuring direction: the staler the page, the more wrong the check.
The second was a Claude Code Stop hook that blocked a turn nine times; the third is this watchdog.
All three were checks that produce the same output when they fail as when they pass. The monitoring chapter of Google’s SRE book covers the discipline in general, for systems with teams behind them. My own rule for a one-person setup: ask, for every check, what you would see if the check itself broke. If the answer is “nothing”, you’re treating silence as good news.
September 16, 09:43
The timer’s next scheduled run came at 09:43 Mountain on September 16 and printed:
FRESH: nothing to doThat was the first run to reach the database since September 1, and the first to report the snapshot fresh since August 30. The latest snapshot reports 5,990 sessions, and you can check it yourself.
If you run a monitor on anything, what would you see the day it lost access to what it checks? If you’ve built the dead man’s switch I haven’t, my email is on the front page.
Links
- The dashboard — the dashboard this watchdog protects, built from my local memory database
- How I Actually Use Claude Code — the launch post describing the workflow behind those numbers
- ntfy and its docs — HTTP-based push notifications, the channel both alerts use
- systemd.timer — reference for the unit type that runs the watchdog
- Monitoring Distributed Systems — the Google SRE book’s chapter on what monitoring should and shouldn’t do
- Healthchecks.io — a dead man’s switch service: it alerts when a scheduled ping stops arriving